There was plenty of driving before the interstates. In the unlikely event this explanation is correct, it should be easy to test: compare the graphs of car and hat sales.
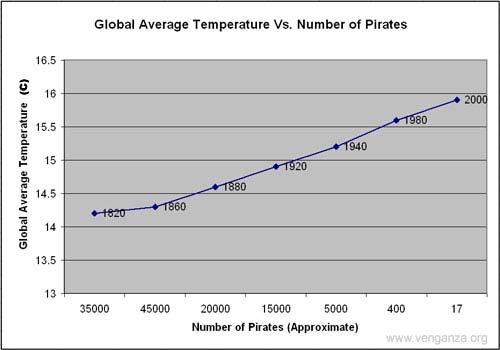
It is common to have time on the x-axis, but that doesn't seem to be the case here. The dots on the line are equally spaced horizontally, but the number of years between each dot varies, sometimes it is 20 years, sometimes it is 40 years, so I don't think the horizontal location represents time.
I'd call this a parametric plot, useful when you have two quantities which vary over time, and you want to visualise how they relate to each other. There are some good examples of that on the Ladder of Abstraction demo, http://worrydream.com/LadderOfAbstraction/ The "Abstracting Over Time" graphic is a parametric plot of the position of the car, where x is horizontal position, y is vertical position, and distance along the line is time.
Oh, I somehow missed that half of the intervals were only 20 years.
But it's not a parametric plot either, because the number of pirates goes up and then down.
I guess it could plausibly be a normal graph with the X axis being some silly function of time; or a parametric plot with the X axis being a stupid function of pirates. But really I think aw3c2 was right: the graph makes zero sense.
Well duh comparing the graphs doesn't provide the answer. But it provides good negative evidence if hats worn declines before interstates, for example. And if the graphs are similar, its a piece of the puzzle towards the answer.
The driving before the interstates happened on dirt roads, country roads, or paved roads in crowded city thoroughfares, with top speeds of less than thirty miles an hour. Automobiles in the '20's sat tall, with lots of interior room (even the low-end Model T had plenty of vertical space); sedans in the thirties began the trend towards lower profiles which continued up through the sporty road cruisers of the fifties. Those sleeker, lower profile designs would have been pointless without highways.
I don't think it's an entirely unlikely explanation.
That style is very trend driven would argue otherwise. Once you reach a threshold suddenly it's unfashionable to wear hats or floral dresses.
There's actually some really interesting literature about how copyright would significantly hurt the fashion industry, because it is dependent on a large degree of 'copying' styles to create trends, which is key to creating planned obsolescence to keep people buying new clothes.